
A brief look at the interact IPython widget!
It has been a while since I wrote a post in the tech/coding category! These days, having some time in between jobs, I am following the excellent fast.ai course on Deep Learning, which beside its main topic is also full of small side learnings on Python, ML in general, education, ethics and more.
A few years ago I had produced some illustrative notebooks outlining the power of the Python data stack, the main one being this one, devoted to NumPy and SciPy. In there I go through some of the many features of these two libraries, mostly for the sake of giving a flavour to people who maybe haven’t used them much yet. The notebook is rendered in the nbviewer in the link but you can download it from Github here and play with it locally - just note that if you do, it will lack access to the functions I’ve placed in a common_functions module within the repo, but you can scrap that part as it’s just notebook-styling choices.
I did a talk about data science tooling to an audience of Python engineers and Scipy was were I had decided to focus - I used parts of that notebook. SciPy is awesome. In the notebook, you can see how you can easily use it for statistical work, for solving equations, for integrating functions et cetera (big et cetera, there’s a lot you can do). I still maintain that the SciPy lecture notes are wonderful and a great way to familiarise with both Python and data science. To this day in 2024, to people asking for a list of things to study to get good in data science I feel like suggesting to give yourself the opportunity to try things with your hands and understand first principles, without going into the details all at once. The basics of stats and maths can be explored exactly with e.g. SciPy. In any case I also maintain a list of resources (many free) on this blog, which I think are fantastic.
One thing I’ve encountered in the fast.ai course is the the interact Jupyter (well, IPython) widget, which allows you to add immediate interactivity to your notebook cells, enabling some simple UI controls.
In the fast.ai course, the instructor uses it to illustrate the agreement between some points, extracted from a parabolic trend with added random noise, and the analytical form of a parametric parabola, the parameters being what you can change in the UI with interact controls. I think it’s a great way to give people a sense of how a function looks like when you change numbers.
I’ve added a quick section to the NumPy/SciPy notebook (given this is still about mathematical manipulations) where I did the same, but playing around with a simple linear function - so, two parameters:
\[f(x) = ax + b\]Note that you can also have a plot title change according to the choice.
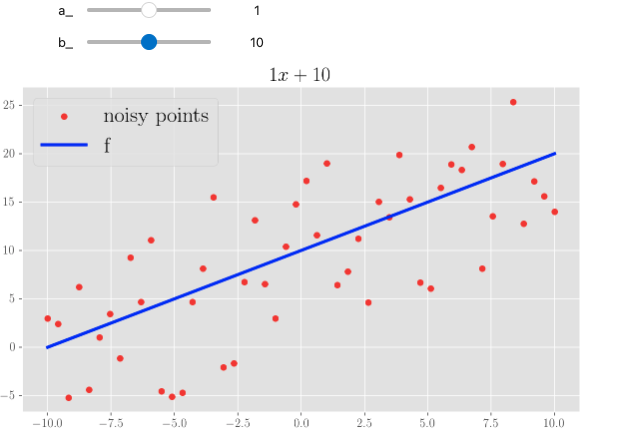
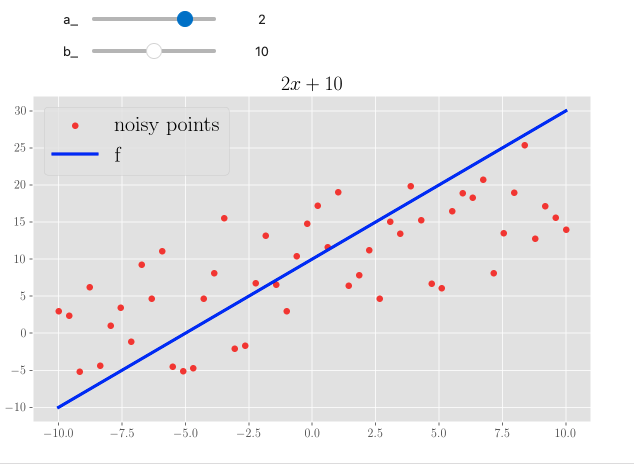
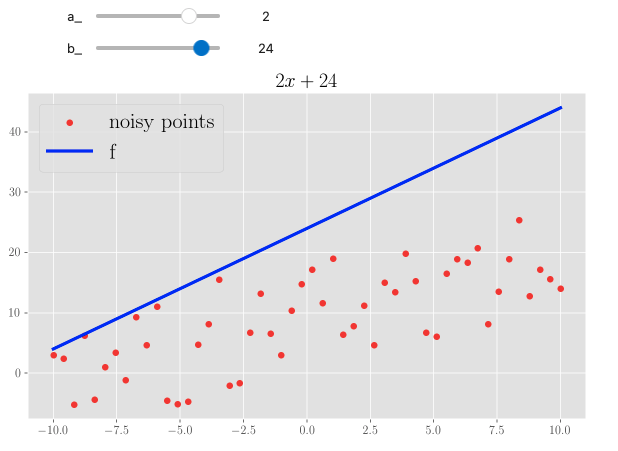
interact. We see a changeable linear function: changing the steepness and the intercept to quickly draw different forms.
Isn’t this wonderful?