A simple movie recommender based on similarity
The fast.ai “Practical Deep Learning for Coders” course is a great start to DL, but it’s also packed full of great clever side ideas and insights here and there, so that every rewatch/re-read is valuable. I was recently looking at the Collaborative Filtering module, specifically this notebook which gave me something to piggy-back for an old pet peeve I have.
I don’t normally find movie recommenders valuable because of a variety of reasons:
- I want to make sure a movie is highly rated before even considering it for a watch, Rotten Tomatoes is still my to-go source - which means manual checks
- Usually, I want a movie that’s somewhat similar to a specific one I have in mind, depending on mood and feel. I’m not normally interested in lists of movies recommended to me because of an overall estimation based on everything I rated at once. Sometimes I’m in the mood for another ’50s comedy, sometimes for a new history film or a biopic, other times I just want a new stunning nature documentary.
This means it takes me time before deciding what to watch and if I could cut that time it’d be awesome.
That fast.ai module uses a subset of Movielens data as a toy dataset to illustrate how to build a recommender, from scratch as well as using fast.ai utilities. I’ll do just the same but will use the latest edition of the Movielens full data dump and curate it to my needs (more on this below), looking at how results can help me with the above goal. Collaborative filtering is a methodology that essentially matches you with new items based on your ratings on items as well as the ratings of many other users - it learns your preferences and who’s similar to you.
I’ll run a quick model to get a sense of what I end up with, I will favour speed over quality, so long as I end up with something decent, and leave potential improvements to another day.
Movielens data
Movielens is a University of Minnesota project. It is a movie recommender based on collaborative filtering whose datasets are regularly released freely. It exists since the late ’90s, which means its data is the longest-standing one in this area and for this reason it is used for research and to teach ML concepts.
Downloading the data
You can download the latest full version of Movielens movie-ratings dataset from here. At the time of writing, it contains data up until mid-2023.
import requests
import zipfile
import io

MOVIELENS_LATEST_URL = "https://files.grouplens.org/datasets/movielens/ml-latest.zip"

response = requests.get(MOVIELENS_LATEST_URL)
response.status_code  # just to make sure we're getting a 200

# Unzip to local folder
with zipfile.ZipFile(io.BytesIO(response.content)) as zfile:
  zfile.extractall('.')   # will create a local folder ml-latest
This will download a bunch of CSVs with movies info (tags for genre), ratings-movies mappings (what I care about) and some other ones. Metadata is taken from The Movie Database.
Note: I won’t report the whole code here but you can follow this notebook: Colab (view only, I may change things in time), Github (versioned).
Basic EDA
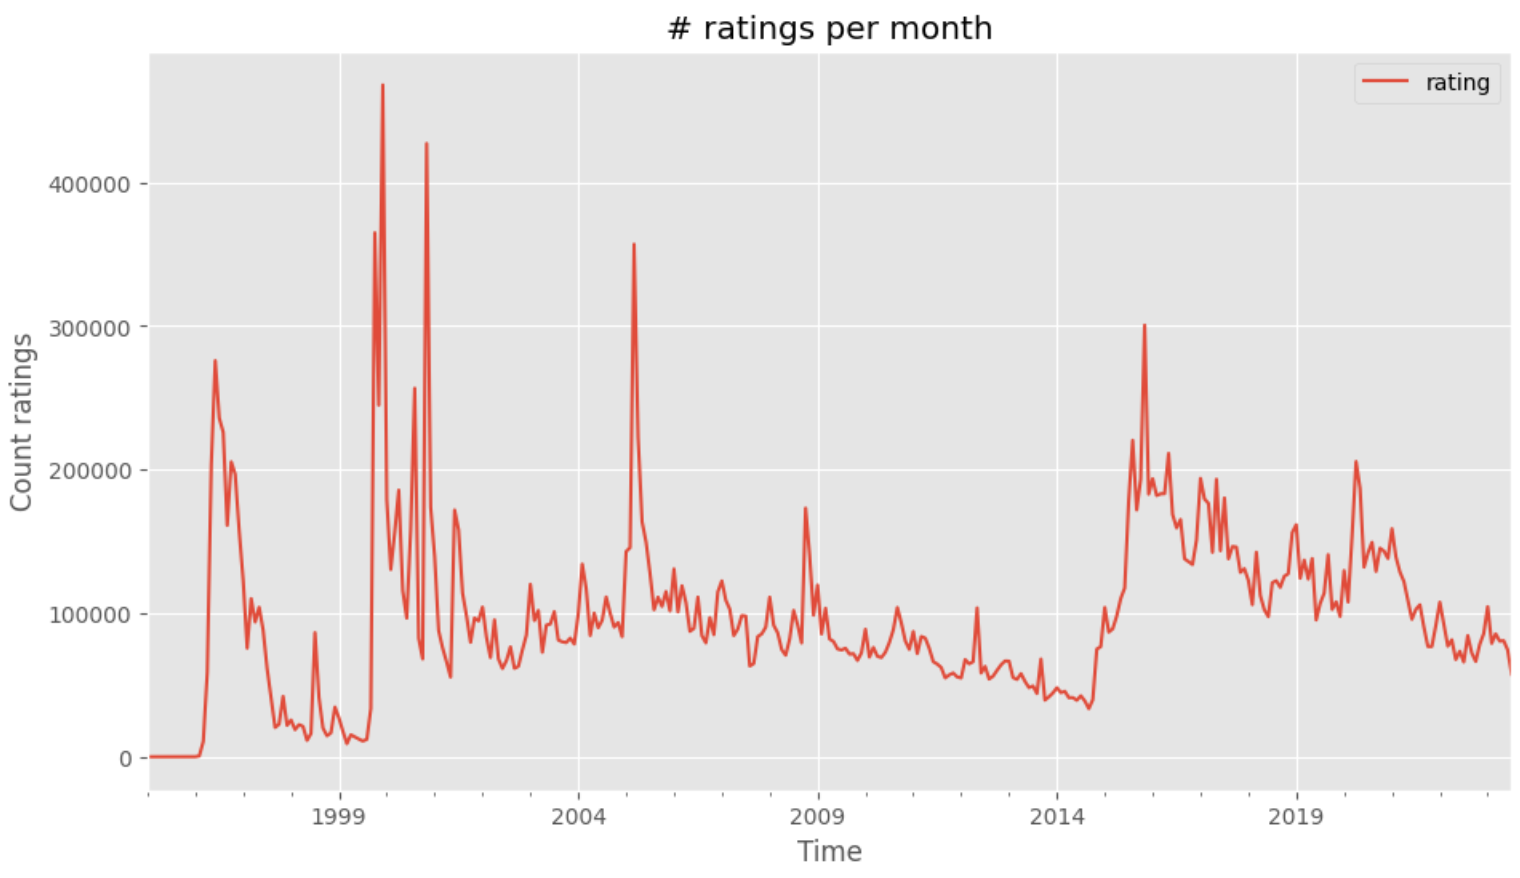
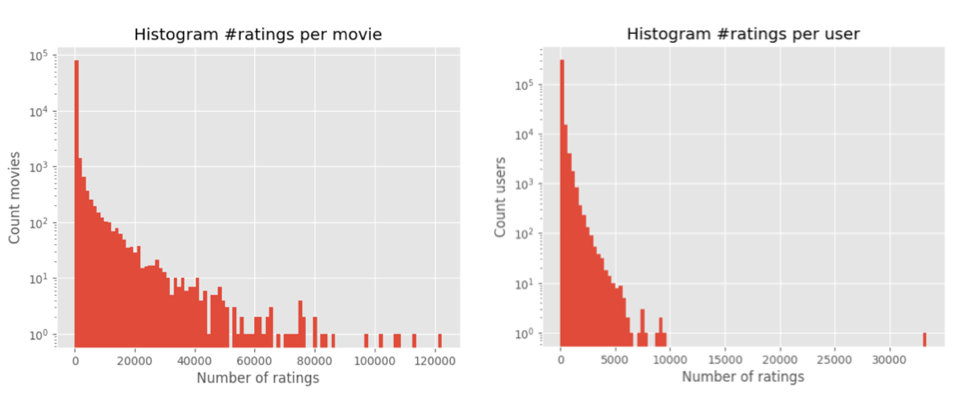
There are ~33.8M ratings in the set, over ~83k movies, from ~330k unique users. The data, as of the README, contains ratings from the start of 1995 to July 2023.

It is out of scope to look at whether peaks correspond to a larger number of movies released, but it’s nevertheless interesting to see that Movielens is still very much used by raters.

“The Shawshank redemption” (released in 1994) has more than 122k ratings - obviously there’s inverse recency bias, in that older films will have been rated more simply because they’ve been around longer.
Curating the set
For reasons mostly related to being able to run a model quickly and ideally without the need for a GPU, I do some cleansing/curation as the data is quite large:
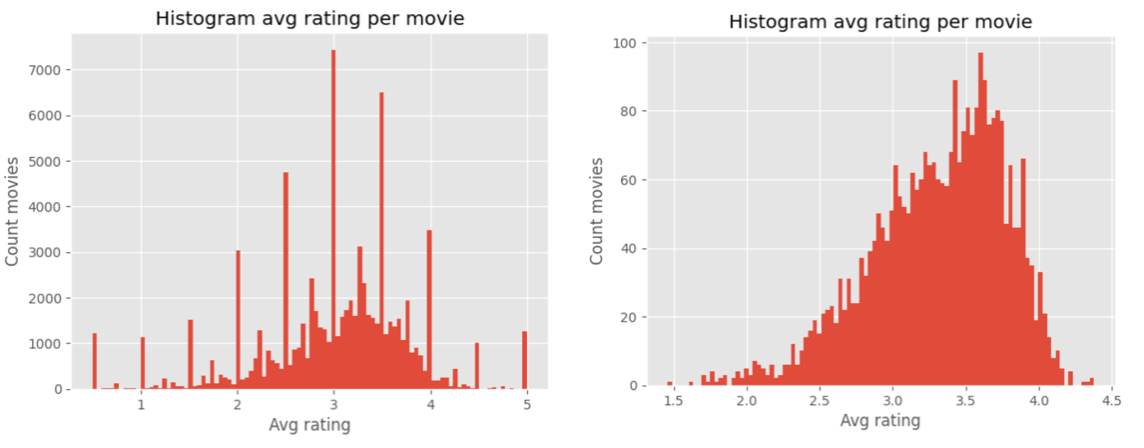
- remove movies with an avg score below 3.5, because I’m only interested in movies that are generally considered good. Of course, this will remove a lot and will bias the set;
- remove movies with less than 1000 ratings, to exclude less reliable data - there’s plenty of movies with a lot of ratings so I can afford this. I want to use the results as a filter so I’d rather lose potential recommendations than have bad ones;
- remove all ratings by users who rated less than 500 movies in total - this is to favour opinions from more committed raters who are power users of Movielens. It will bias the set because I may end up with a userbase that’s less representative of the general population, but I feel that’s fine, I’d rather have qualified opinions (the idea is that people who rate a lot are more likely to rate honestly).
Rating scores in Movielens range from 1 to 5.

I end up with 2145 movies with ~2.1M total ratings from ~3k users. These movies-ratings may still a bit too many for a quick simple model though (read: I tried the below and it was very slow), so I decided to sample them in such a way to preserve the fraction of ratings in each score, taking 10% of all ratings per movie.
Collaborative filtering
I’ve then used collab_learner from fast.ai in the non-neural net modality, which performs gradient descent to learn embeddings for movies and users in the forms of weight factors and biases over a latent space of chosen dimensionality. Embeddings for movies in this latent space encode features of the movies like their vibe, subgenres, quality. They are learned from the users ratings only and not informed by any metadata, which is the fascinating part of collaborative filtering. I won’t go into the details of this but again the fast.ai lesson is great.
With df being our dataframe of movie-ratings (the matrix), I run
# build dataloaders
dls = CollabDataLoaders.from_df(df,
                                user_name='userId',
                                item_name='title',
                                rating_name='rating',
                                valid_pct=0.2,
                                bs=64)

# run a collab_learner (EmbeddingDotBias model) with 50 latent factors
learn = collab_learner(dls, n_factors=50, y_range=(0, 5.5), use_nn=False)   # 5.5 because 5 is max score in the data

# and fit it
learn.fit_one_cycle(5, 5e-3, wd=0.1)
The model learns decently, doesn’t overfit and is relatively quick: I can run an epoch in about 30s on CPU (I’ve been using Google Colab). I run it for 5 epochs which gives me decent stats.
The bias for a movie encodes information about how much that movie is generally liked; the bias for users encodes how much that user generally appreciates movies, so these are important terms to use for a general assessment of what I’ve got.
Results
I get these as the movies with the highest movie bias, that is, the most generally appreciated ones:
| movieId | title | genres | year |
|---|---|---|---|
| 296 | Pulp Fiction | Comedy,Crime,Drama,Thriller | 1994 |
| 318 | Shawshank Redemption, The | Crime,Drama | 1994 |
| 593 | Silence of the Lambs, The | Crime,Horror,Thriller | 1991 |
| 858 | Godfather, The | Crime,Drama | 1972 |
| 2571 | Matrix, The | Action,Sci-Fi,Thriller | 1999 |
and these are the one with the least appreciation (remember, these are still good movies overall because of how I curated the dataset):
| movieId | title | genres | year |
|---|---|---|---|
| 334 | While You Were Sleeping | Comedy,Romance | 1995 |
| 1688 | Anastasia | Adventure,Animation,Children,Drama,Musical | 1997 |
| 5991 | Chicago | Comedy,Crime,Drama,Musical | 2002 |
| 49286 | Holiday, The | Comedy,Romance | 2006 |
| 98243 | Rise of the Guardians | Adventure,Animation,Children,Fantasy,IMAX | 2012 |
This sounds credible enough. Now I can use cosine similarity between movie embeddings to retrieve movies most similar to a given one.
For “Mary Poppins” (the 1964 original), I get (asking for 5):
- 'Sleeping Beauty (1959)',
- 'Lady and the Tramp (1955)'
- 'Cinderella (1950)'
- 'King and I, The (1956)'
- 'Beauty and the Beast (1991)'
which are all old animation/family ones, looks good.
For “Paddington” (2014, the first):
 - 'Paddington 2 (2017)',
 - 'Kubo and the Two Strings (2016)'
 - "Dr. Horrible's Sing-Along Blog (2008)"
 - 'Dope (2015)'
 - 'Bo Burnham: Inside (2021)'
it’s good it’s pulling the sequel - these should all be family-friendly except possibly the last one, but the model may have picked on the fun/quirky element and/or it’s just not always good.
For “Hidden Figures” (one of my favourite movies of all time):
 - 'Best Exotic Marigold Hotel, The (2011)'
 - 'Hacksaw Ridge (2016)',
 - 'Sully (2016)'
 - 'Impossible, The (Imposible, Lo) (2012)'
 - 'Saving Mr. Banks (2013)'
this is interesting: the first seems to be a comedy, the fourth is a disaster movie (not a fit, I’d say), the rest are biopics/historical ones which seem like a decent fit.
I could definitely improve the model (see below) but this is already a very good filtering system I can use as-is whenever I’m in the mood for something that would be hard to articulate in a search! Of course, these days I could use chatGPT or the like for this purpose and chances are I’d get decent recommendations, but where would be the fun in that?
Using PCA
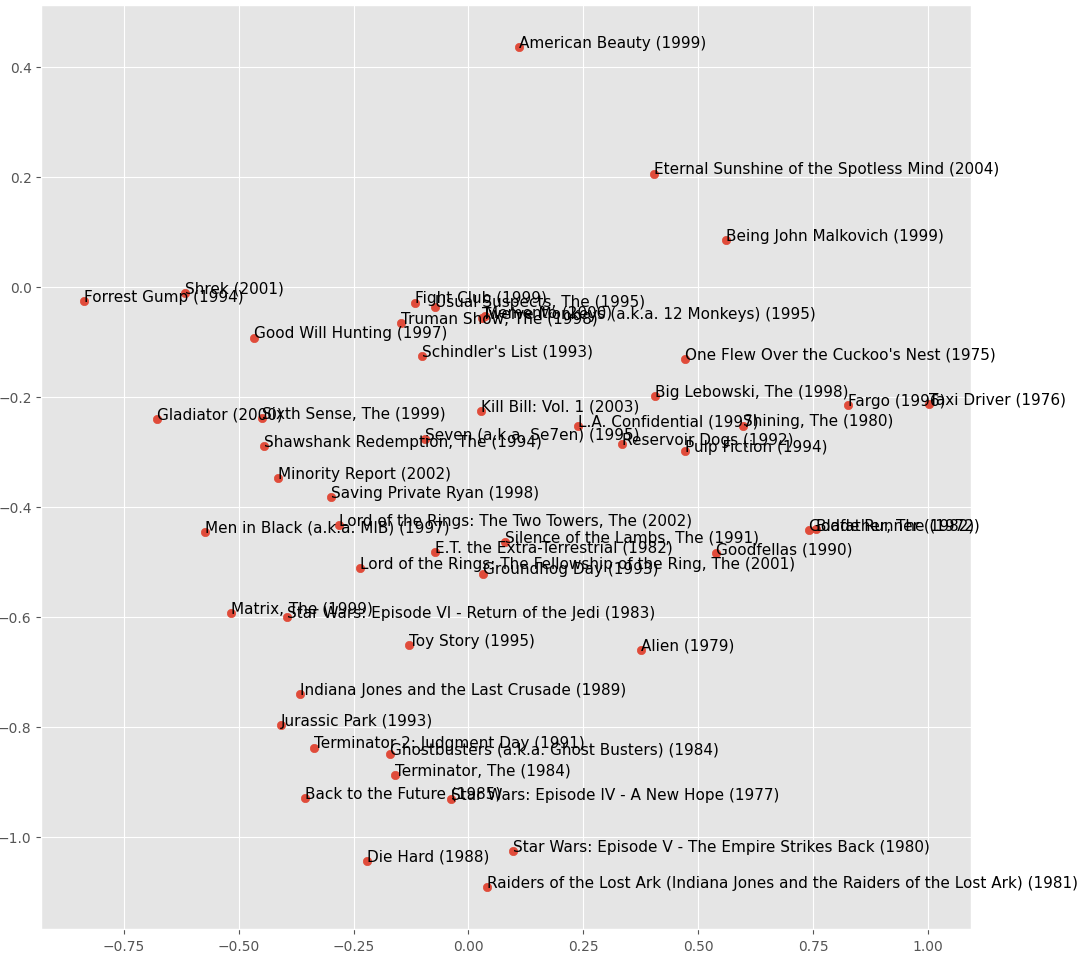
Principal Component Analysis is an algebraic technique to reduce dimensionality of large matrices while preserving most of the information and variability. It can be very useful even just to visualise data, like we’ll do here. This part is also piggy-backed from the fast.ai lesson. I have vectors of movies embeddings in the latent space of the 50 dimensions I’ve asked for, but if I PCA them to then draw the 2 components with highest variance I get this plot, which is a good proxy to visually see similarity “clusters”:

The clustering isn’t amazing but you can see some patterns. For instance, the model seems to have picked that “The big Lebowski” and “Fargo” (which makes a lot of references to the former) are similar; there is a Sci-fi cults area (with occasional infiltrates like “Die Hard”); there’s an area of quirky crime ones and so on.
Conclusions and things I could improve
It wasn’t my aim to create and tweak a great model, but I’ve (quickly, thanks to fast.ai!) got my filter which I can now use to have a list of movies similar to one I like with no effort. The movies are all highly rated by the Movielens community, which doesn’t necessarily mean they’d be highly rated on Rotten Tomatoes, but I’m sure the correlation will be high (it will be interesting to find cases where this isn’t true). Every time Movielens produces a new data dump I can update my model.
A lot of things could be improved:
- first of all, reduce the draconian size-reduction operations on the dataset I had to do to keep this fast in training
- train on GPU - I didn’t invest time or money into this and Google Colab isn’t reliable in the free tier because one moment you have a GPU and the next you don’t anymore, but with a little expenditure you can train more properly. Or, you can use the Kaggle free GPUs too.
- tie the results to Rotten Tomatoes (doesn’t have an API AFAIK though, so you’d have to scrape) as a further post-processing filter
Hope you enjoyed this, chat to me on Bluesky.