
Plotting the actual frequencies in a FreqDist in NLTK
Some days ago, trying to visualise a frequency distribution of tokens in a text via NLTK, I was quite surprised (and slightly disappointed) to see that the plot() method of the FreqDist class does not support a kwarg for plotting the actual frequencies, rather than the counts.
Now, the term “frequency” in NLP is borrowed from Linguistics, where it’s used to mean the counts, not the actual frequency of occurrence of a linguistic something. I personally never quite liked this usage of the word as I find it pretty confusing: a frequency is, typically, a ratio of the occurrences counts of that something to the total of every something in the set.
FreqDist is creating a dictionary of counts, not frequencies, which is quite alright. Then you can directly plot them by calling the class method plot(), without the need to externally call pyplot. I was expecting that among the kwargs allowed by the method there would have been something to normalise said counts to transform them into frequencies. As of NLTK’s version 3.2.1, there isn’t. The freq(sample) method gives the frequency of a given sample, but nothing enables the possibility for frequencies to be directly plotted.
My hack to obtain this is then: What we’re doing here is simply normalising the counts to their sum, paying attention to the fact that N(), which does return this sum, changes when we change the values, so we need to store it beforehand. All the other existing kwargs are preserved for consistency.
My hack to obtain this is then:
def plot_freqdist_freq(fd,
                       max_num=None,
                       cumulative=False,
                       title='Frequency plot',
                       linewidth=2):
    """
    As of NLTK version 3.2.1, FreqDist.plot() plots the counts
    and has no kwarg for normalising to frequency.
    Work this around here.

    INPUT:
        - the FreqDist object
        - max_num: if specified, only plot up to this number of items
          (they are already sorted descending by the FreqDist)
        - cumulative: bool (defaults to False)
        - title: the title to give the plot
        - linewidth: the width of line to use (defaults to 2)
    OUTPUT: plot the freq and return None.
    """

    tmp = fd.copy()
    norm = fd.N()
    for key in tmp.keys():
        tmp[key] = float(fd[key]) / norm

    if max_num:
        tmp.plot(max_num, cumulative=cumulative,
                 title=title, linewidth=linewidth)
    else:
        tmp.plot(cumulative=cumulative,
                 title=title,
                 linewidth=linewidth)

    return
What we’re doing here is simply normalising the counts to their sum, paying attention to the fact that N(), which does return this sum, changes when we change the values, so we need to store it beforehand. All the other existing kwargs are preserved for consistency.
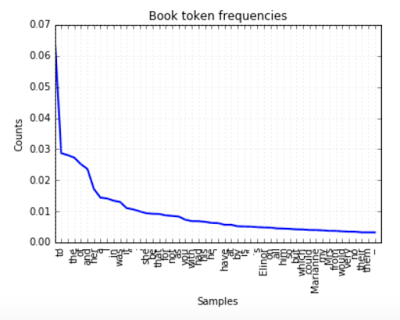 The result is in figure, for the text of Austen’s Sense and Sensibility (available as a book in the NLTK data), we’re plotting the frequency of the 50 most frequent tokens.
Looks like to is the most frequent token (note that no pre-processing/removals have been employed), with a frequency of around 6.5%. Having this number might be much more interesting than the count (which is around 9000, for reference).