
Books I’ve read - in the ages
If you are an avid reader or even just the intermittent bookworm, you probably have a “want to read” list of books longer than your “read” list. That is my case.
To track my reads I use Goodreads. I don’t love its old-fashioned interface, I wish it were still under active development (it’s not), but it remains the place where I have invested most of my time tracking what I read and creating wish lists. Goodreads was bought by Amazon in 2013 and since then it’s been pretty much abandoned - it has allegedly got to the point that it would need a complete architectural overhaul, something that Amazon apparently deemed not worth its time and effort. Of course it also suffers from problems common to many social media: issues with online abuse and fake reviews. If you’re interested, theres’s many great alternatives, some of which in the Fediverse.
Anyway, back to the point here. Since I was very young, I always loved reading so-called “classics of literature” but in latest years (couple of decades really) I started spending most of my time with either contemporary fiction or non-narrative texts. I got curious to see the distribution of my reads per decade of publication.
Luckily, you can easily dump your data out of Goodreads (as a CSV), and so here is the plot.
In regards to the scope of the “data cards” section of this publication, I realise I’m cheating a bit here - this isn’t a hand-drawn viz. Sorry, but really there was not much to draw and a simple 5-mins (make it 10) effort with a Google sheet was more than enough for what I needed. At some point, I will talk more about choosing the path with the best compromise between effort and value when you do data work.
You just have to filter out everything not in the “read” shelf, create a column for the publication decade and then use a GROUP BY to count the titles for each. If you want, I can pass you a copy of the sheet you can use as template to do the same.
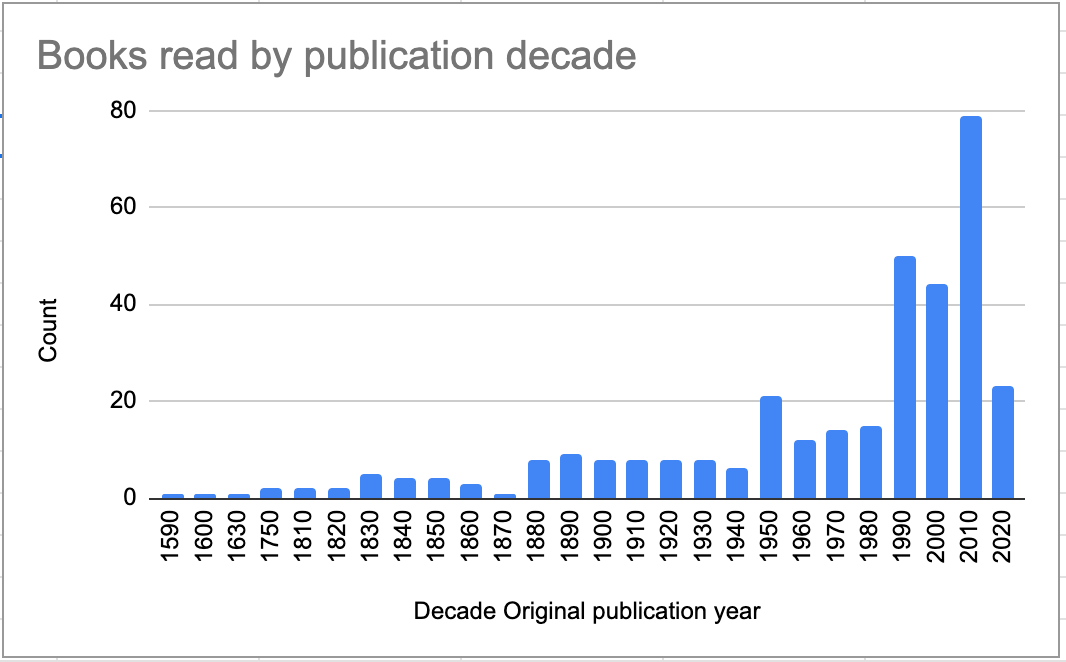
Important: this is not a really good visualisation because given the x-axis is a time variable it may be perceived as a time series. It’s not, it’s a histogram: it just shows the counts per category, in this case the decades, and this is why there is no representation for e.g. decades between 1750 and 1810 - apparently I’ve got nothing read that was published in those years.
Anyway, you can see most of my reads are books of recent publication. I want to populate older times a bit more as I am missing so many great “classics”, so I will occasionally post this plot again, say in a few months, and see how things have changed. I have currently resumed reading older stuff, starting with some Steinbeck (which I had never read before and I am really, really liking).

For another time: looking at the geographical distribution of my reads, based on the author’s nationality/biography. It won’t take a visualization to discover that the vast (vast, vast) majority of what I’ve read is Western.