
The EU of working women
Every year on the 8th of March see and read “inspirational” messages on gender equality from various institutions, companies and organisations that remind us of how great women are and how cool the organisation is at fighting the patriarchy. As many keep saying on this date (and I’m with them), it’s one thing to talk about how equal and good you are, it’s another thing to really act towards actual equality (also, it is yet another thing to demonstrate that you are actually equal). After all, talk is cheap.
If we look at just one statistics, the percentage of women of working age that are actually at work, would you know what that is in your country? In this little work, we will be looking at the EU - I may be inspired to do a deeper analysis that looks at global data later on.
Items to bring along
I could come up with plenty of items on this complex topic, but I’m going to limit it to two.
A social media bot
If you don’t know it, the Twitter Gender Pay Gap Bot retweets, every 8th of March, those posts that companies make to “celebrate” women adding info about the pay gap at those companies. The gender pay gap is that phenomenon whereby there is a significant difference in salary between male and female across the population, which can be due to several reasons:
- women get paid less for the same role - this is of course straight discrimination hence illegal in most places but can still happen “under the hood”,
- women may have more career breaks, often (but not only) owing to childcare responsibilities (not shared fairly between male and female parents), another face of the same coin,
- women may cover more part-time types of jobs than men (often for reasons related to the above),
- women may occupy less managerial and high-profile roles than men, a cause of the phenomenon but itself a manifestation of the patriarchy,
- women may suffer from implicit (or even explicit) discrimination that hinders their career advancement,
- …
Overall, it is prejudice and it is unfair.
The bot concerns the UK and uses public data, reachable here (governmental site). I’m not sure whether it a legal obligation for companies to publish statistics about their pay gap, but this data is certainly much welcome as I don’t think there’s many other public datasets like this one around, so kudos to the UK.
The bot reports the difference between the median salaries of men and women at the organisation. Now, looking solely at the difference in medians isn’t capturing the whole essence of the problem of course, but it is a start, and definitely contributes to raising awareness. As outlined above, several factors are at play and they contribute together towards inequality - it isn’t easy to districate causes and effects.
A movie: 9 to 5
A lighthearted tale about the office life of some American ladies, 1980. There’s Fonda, Tomlin and Parton, which per se is a good reason to watch it, but all in all it is a very good movie. These ladies teach the (male) boss a painful lesson when they rebel against his toxic and misogynous attitudes. Funny and witty, and inspired by real events - Netflix also has a documentary about the 9to5 movement.
The movie is not immune from stereotypes (the women are all “attractive”, for one), but you have to contextualise to the fact that it dates back from 1980 and it was tailored to a general audience, keeping a light tone.
Alice Orrù in Ojalá talks about this better than I can [in Italian].
The data card
Here it is, it represents each country in the EU with its percentage of women at work, considering the age group 20-64.
Data is from 2017 (from Eurostat, here you find the most up-to-date one, which is for 2018), I did this card a while ago, definitely before the COVID pandemic.
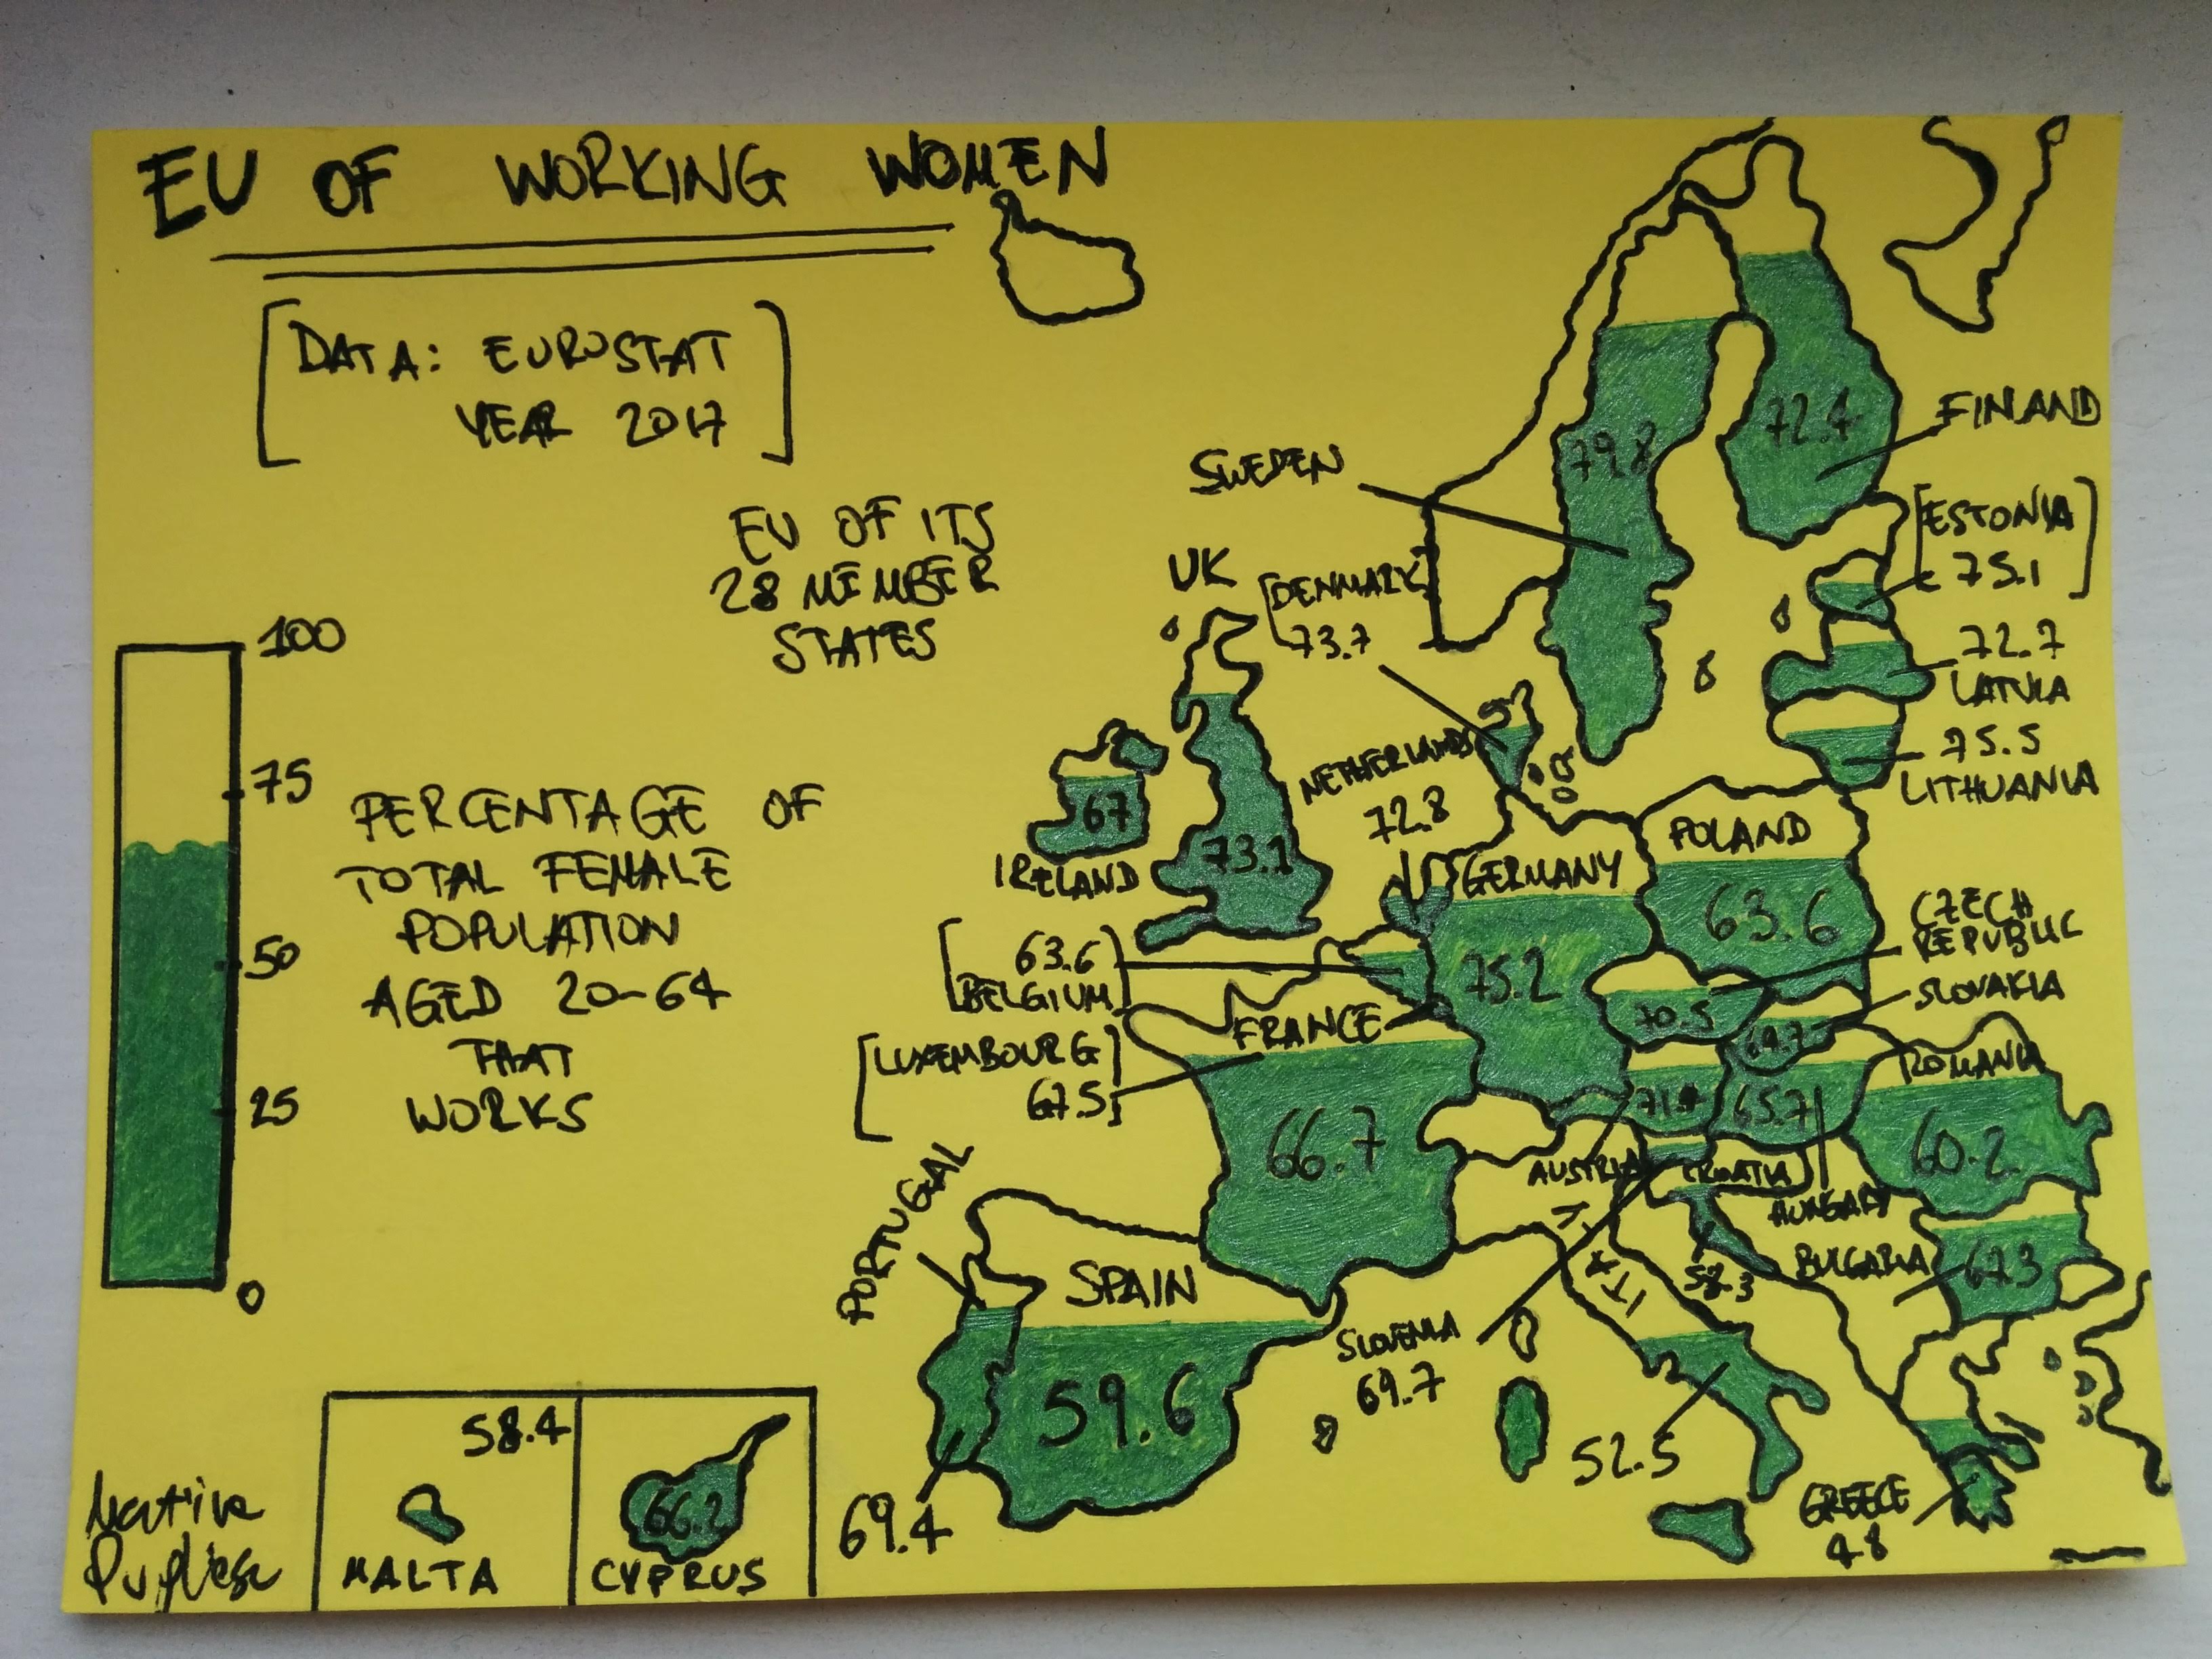
The UK is represented because of course the data refers to the pre-Brexit era. So, we are faring around 70-80% for Northern Europe and 50-60 % for Southern Europe.
A few considerations:
- the minimum pension age isn’t the same in every country and there are in fact sensible differences - it’s a timely topic as e.g. France is currently debating raising it from 62 to 64 (which means that likely for France the age bracket 62-64 is less populated that elsewhere);
- the low percentage in Southern European countries are really disappointing, and we need to contextualise with the fact that general employment rates are lower (or, if you want, unemployment rates are higher), which means that less people are at work in the first place. This situation may also go hand in hand with work that is “hidden”, not known to the fiscal authority, illegal - basically people do work but they don’t have real contracts;
- I’ve not looked at more recent data and I’d really like to be challenged in my assumption that things haven’t changed much in 5 years;
- This says nothing about a gender difference, we should look at the male counterpart for that. Well, a quick glance at the most recent version Eurostat publishes on the same data, with male and female percentages shows that male percentages are always higher, and in some countries the gender difference may reach 20 points!
- This also doesn’t stratify by age range: most likely the percentage of working women increases with lowering age.
A final thought
With this I limited myself at presenting data on this complex topic, without the presumption to cover it in the detail and care that it deserves. As it is hopefully clear from what I clumsily presented in here, it isn’t trivial to ascertain real causes and understand confounding factors - the phenomenon is really complex. However, it isn’t difficult to start implementing policies that improve the situation (I am not thinking quotas, which are controversial per se), and it isn’t much to ask to finally start looking at this problem from the perspective of the data.