New England Recipes, circa 1900
Today, we’re looking at data about food recipes from New England dating from the early 1900s. “New England” is the collective name for the group of United States comprising Massachusetts, Maine, Connecticut, New Hampshire, Vermont and Rhode Island; the cuisine of the area is heavily influenced by its English roots but also includes some all-American favourites like clam chowder.
For our exploration, we will use the text of book “Our New England Family Recipes”, put together by Mrs. Francis Jarvis Patten and published in 1910 by the “National Society of New England Women”, which I found while looking for data about the cuisine of the place. The book is freely available on the Internet Archive via the Library of Congress but you can also buy a reprint; I love the disclaimer that comes with it:
“Due to the age of this book, some methods, beliefs, or practices may have been deemed unsafe, undesirable, or unacceptable in the interim years.”
I can’t find much information about Mrs. Francis Jarvis Patten, but the National Society of New England Women is (it is still alive!) an organisation which aims to (quoted from the website) “bring women together of New England ancestry to engage in patriotic, educational, and charitable work and thus perpetuate the lofty ideals and examples of their forefathers”. It was founded in 1895.
The book is organised into chapters based on food categories, the recipes are written in a short and snappy fashion with a pretty colloquial tone - the text abounds with things like “four eggs, cup sugar, cup flour” or “Mix at night, place in pans. Bake in the morning. Slow oven”. It’s delightful to read, really.
Bring-along items
As always, we’ll choose three items to bring along on the journey and immerse ourselves in the period and the atmosphere. I choose a movie (or the book it came from), a place and a recipe from the book itself.
A movie (or a book)
The movie is “Little Women” in the 2019 version by G Gerwig. It’s gorgeous and it’s on my (very short) list of favourites, those movies I rewatch every now and then.
I really like it as I think the photography is stunning, the acting is great and the story is charming yet with good layers of complexity, but I have to say I am a sucker for period dramas. I think it does a brilliant job of being even better than the 1994 version with Winona Ryder and a bunch of other greats that used to be a Christmas-time staple of my childhood.
About the book this comes from, I confess I never read the original. As a child (I must have been about 8) I read a very abridged version full of pictures which was very nice. I may give the real one a go some time.
A place
Let’s keep it in New England: I recommend a visit to the Boston Public Library (Central Library).

The library was erected in 1848 and has been a first in many things in the USA. It is a wonderful place to visit if you happen in Boston (which is a fantastic city), with its majestic halls and the many historical artefacts, including murals by J S Sargent. You can admire more pictures from fellow travellers on Google Maps.
A recipe
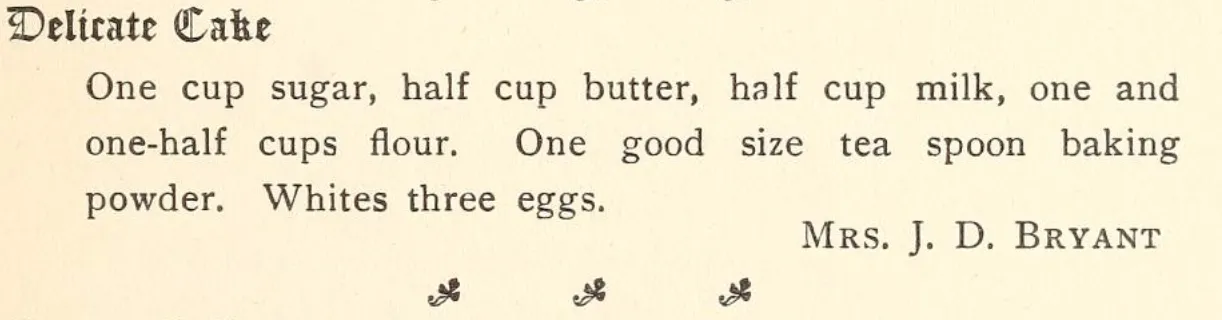
For the third item, why not choosing a recipe from the book itself. I’ve gone to a random page and here it is, the recipe of the “delicate cake”. It is a great example of the colloquial style I was talking about earlier - it doesn’t even tell you how you should prepare your egg whites for instance, so I’m pretty sure if I attempted this it wouldn’t end up delicate at all.
The data card
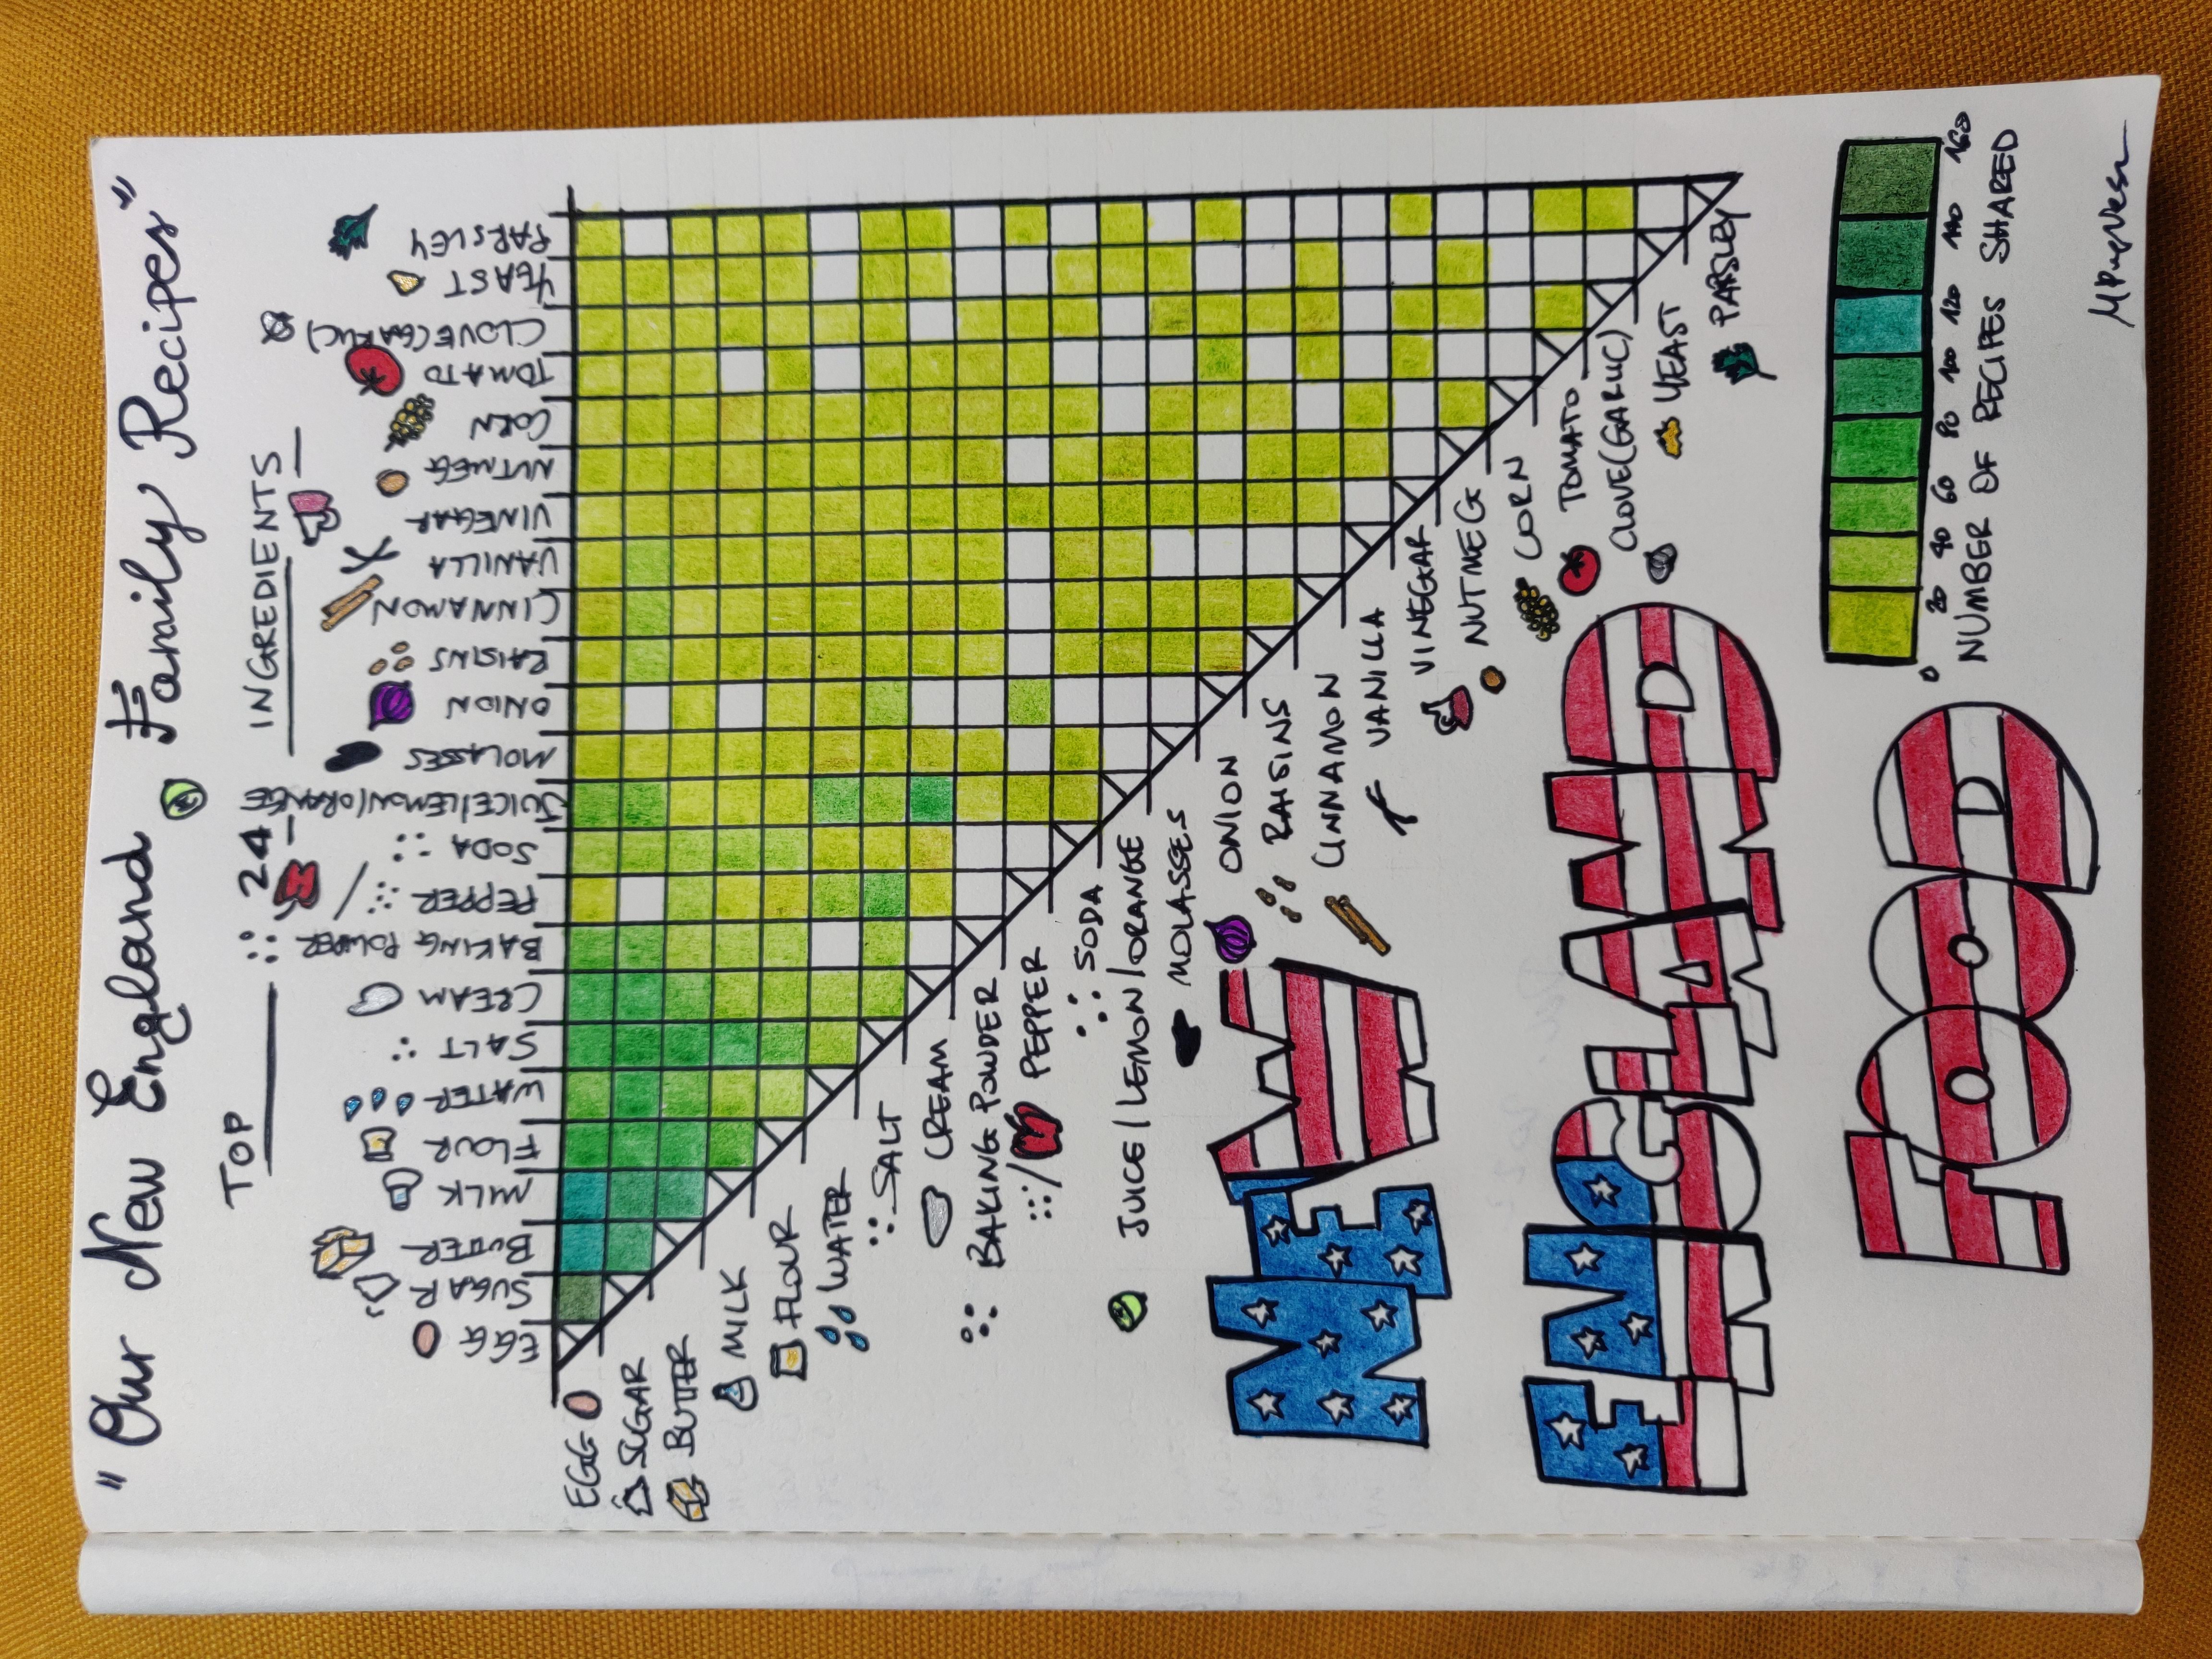
In this card, I have represented the 24 most common ingredients overall and have counted the number of recipes that contain any couple of them. I chose 24 because it was a good number for the space I had on paper, given how I wanted to display the information.
The visualisation is a heatmap where each square is colour-coded, in shades of green, according to the number of recipes that share that couple of ingredients; note that because the order in the couple doesn’t matter (so that egg-sugar is the same as sugar-egg) I have only drawn half of the map, otherwise you would have seen repeated information. The number of recipes shared is bucketed (or “binned”) and there is a legend at the bottom for the shade of green. For instance, the couple egg-sugar appears in 152 recipes (out of 339!) and has the darkest green; the couple vinegar-parsley on the other hand appears in just 2 recipes. A white square means that that couple has not been encountered in any recipe.
There is a clear predominance of ingredients for sweet things, which is not surprising given that about half of the recipes are for cakes and desserts of sorts (I counted the numbers for each category). This is clear even from the list of top ingredients itself. Egg goes literally with everything, and parsley is the least popular companion ingredient. You can imagine that if I had displayed more ingredients, you would have seen more and more white squares.
There are some odd combinations, like nutmeg and garlic clove, but I cannot exclude that they may be due to errors in the text processing (see below for the technicalities behind this work). Also note that “pepper” can be either the spice or the vegetable, thanks to the ambiguity of English that uses the same word for both - I have drawn the vegetable to represent it, but I think in many cases it is the spice instead.
Technical bits: how did I make this?
I have used free data from the Internet Archive, which, amongst other things, digitises physical books and offers them into various formats, some of which are machine-readable. I’ve downloaded the original data in TXT from this page and used Python to analyse it; you can find the Jupyter notebook I created for all this work here. The text has been digitised by means of OCR (Optical Character Recognition), a technique that allows for text to be extracted from images.
If you download the text yourself, you will immediately notice that for many of the recipe titles the OCR process hasn’t worked that well: we have things like “W\tAz WbtRt ^reaH” for “Whole Wheat Bread” or “^lueberrp Cafee from JHatne” for “Blueberry Cake from Maine”. It’s because of the typeface used, I think it may be “Olde English” or some variation/precursor of it, probably quite popular in books of the time - here is a nice overview of old fashioned typefaces you can use today.
Furthermore, in the section headers oftentimes an “E” has been read as an “L” (due to the fact that in the font the lower stroke is longer and ticker and an “S” has been read as a “5” (you can see how this happened :D).
I have decided not to do anything about this for reasons that I will explain later, because it actually comes in handy.
A preliminary little text analysis
I have used the Python library TextBlob to analyse the text.
Ignoring the issue with fonts, let’s start by counting the words. TextBlob has an API for tokenisation (the process of splitting a string of text into its “tokens”, individual components),
f = open('our_new_england_family_recipes.txt')
blob = TextBlob(f.read())
len(blob.words), len(set(blob.words))
I get 23230 total words and 3508 unique words. Out of curiosity, if instead I split the text manually using both a space and a newline as delimiter (as I’ve eye-checked that many words are separated by a newline only), I get 23197 total words. We will go with the TextBlob tokenisation as it most certainly uses some smart choices in deciding how to tokenise.
Word frequencies
If we naively look at which are the most frequent words in the whole text, we get a lot of “stopwords”: these are words that do not have semantic content but are rather used as connectors, such as prepositions and conjunctions (“and”, “to”, “in”, …). The definition of a stopword is not really universal however, as it may morph with the context: in specialised texts for instance one may consider as stopwords all those nouns that refer to concept commonly talked about in the book (e.g. “model”, “size”, “fit” in fashion texts). If you’re interested, some time ago I did an exploration of stopwords as they come off-the-shelf from some popular Python libraries.
In any case, using NLTK’s list of English stopwords to remove them from the whole text and then compute word frequencies (in terms of counts of occurrences) we obtain the following figure (for the 30 most common ones).
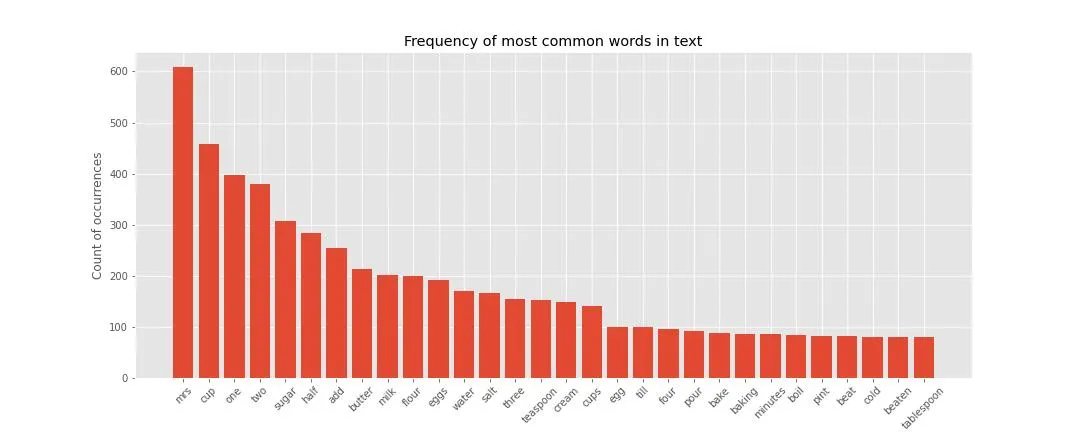
Note that the text has been lowered in case, so that things like “Bread” and “bread” count as the same item. The most frequent of all words is “Mrs”, which is not surprising given that each recipe carries the name of the person that proposed it, often a “Mrs.” - this is a (case in point!) perfect example of what should be considered as a stopword for this text. Amongst the most frequent other words we have ingredients like “sugar”, “butter”, “milk” and sizing/portioning words like “cup”, “one”, “two” etc. It seems quite clear that in this book there is a prevalence of sweet stuff.
Note that there is also a chapter for the “Grandmother’s cooking (Poem)”, which is, indeed, a poem - it’s quite funny, have a read (it’s on page 70): it is an ode to the good ol’ times of grannies cooking with mastery and skills and without all the “hygiene and invention” of today. Wonder what these ladies might think of today’s ready meals.
Separate recipes and get the nouns
We will now select all nouns for each recipe, via POS tagging, and we will lemmatise them (that is, group all possible inflections of the same work, like plurals, into one) - this leaves us with a total of 1397 unique noun lemmas.
Note that thanks to that typeface which fails in getting recognised well by machines, POS tagging automatically ignores recipe titles, which is helpful in this case as we want just the recipe text. I have also used some regex-matching to clean-up things like page numbers that split a recipe and at the end I removed strings too short to be recipes.
The most common noun lemmas are in agreement with the most frequent words found above:
('mrs.', 597),
 ('cup', 535),
 ('sugar', 306),
 ('egg', 289),
 ('teaspoon', 203),
 ('milk', 201),
 ('butter', 200),
 ('water', 169),
 ('salt', 164),
 ('tablespoon', 146),
 ('cream', 141),
 ('flour', 140),
 ('half', 137),
 ('pound', 112),
...
There are some mistakes, like “twenty” (which isn’t a noun), but we will pretend they’re not there and be content with what we’ve got. At the end there will be some other manual cleansing/choosing to do anyway.
At this point we can compute the combinations of any two nouns within each recipe. Afterwards, because not all nouns are ingredients of course, I manually scrolled the list to exclude combinations that are not composed of two ingredients. Of course, because of POS-tagging errors I also end up with combinations containing things that aren’t nouns at all, which get ignored.
At the end, I ranked these ingredients combos by frequency and plot them on a heatmap - that’s it!
Notes for the improvement of the viz
This is where I do a mea culpa and acknowledge a few of the things I could have done better:
- I could have gone beyond combinations of 2, this might have been more interesting data-wise, but would have been harder to visualise;
- I could have chosen a palette of colours that showed higher divergence;
- For the binning, I could have used a scale that wasn’t linearly spaced in order to distinguish better in the lowest portion of counts - this would have improved on the big blob of light green;
- I thought about this too late, but I should have grouped together “soda” and “baking powder”;
- I could have separated the two types of pepper (spice and vegetable), but this would have required either some more sophistication in the text processing or, failing that, a manual check - either way it would have taken some time.
(Short) story of a failure
This data story wasn’t supposed to be about New England. My initial idea was visualising the food scene of New York City in all of its melting-pot glory. I was hoping to peruse this Wikipedia page to chase the origin of each food and then do a simple bar plot of the counts by country of origin.
Unfortunately, because the business of tracing the origin of food items is a tricky one, this proved to be not really possible. Food is culture, it changes in time and space moving with mankind and adopting new flavours: NYC is a brilliant example of this as you can find virtually any cuisine in this city.
For many food items, it makes little sense to even try to figure out where they came from as the origin may be lost in time.
Also, it is hard to even classify foods as per their origin. For instance: you can say that the origin of NYC-style pizza is Italian, but what about things like “pasta primavera”, a staple of the Italo-American cuisine - would you classify its origin as Italian or American? Likely the second, given it has been invented in the USA, but it has a clear Italian inspiration.
Another clear stumbling block I have encountered has to do with Jewish food, so popular in NYC: while some items have a clear ancestry (such as the bagel, which originated in Poland), many others don’t, so this would have left me with a very incomplete dataset.
In fairness, this failure was predictable as food is not something you can accurately classify. I have learned a few things and I want to give a big shout-out to this fantastic resource I found: the Food Timeline. It is the brainchild of historian Lynne Olver, who collected, analysed and put together food books from all times, creating a timeline and offering resources for further exploration. The site opened in 1999! It is a brilliant project and I just love this paragraph about their “market strategy”:
If you fill a niche, people will come. Pure and simple. Our site began as a public educational service and so it remains. We have never paid seach engines for premium placement, solicited reciprocal links, partnered with book vendors, or sold advertising. FT traffic grows because we add (credible/vetted) content readers want and answer their questions in a timely manner. We still hand code html & today’s readers comment the site is “ugly.” We acknowledge: what was cutting edge in 1999 is now stale. Conversley? FT looks so old it’s become vintage. Medium & content blend perfectly. Quick load across all platforms turns out to be a major plus. FT readers are truly amazed to get personalized answers from Web sites. Lesson here: if you invite customers to ask questions, you better respond!
The Food Timeline definitely deserves a place on the list of data resources I keep for my cards.
References
- F J Patten, Our New England Family Recipes, 1910, freely available from the Internet Archive (via the Library of Congress), and it looks like you can buy a reprint if you want.
- The website of the National Society of New England Women
- Little Women, the movie (2019), on The movie Database, and the 1994 version too
- The Boston Public Library website
- Cuisine of New England on Wikipedia
- An overview of old-fashioned typefaces you can use today and that are similar to the one used in the book recipe titles
- TextBlob, a Python library to analyse text
- A post about stopwords I wrote on my blog a while ago
- The Jupyter notebook with the text analysis I did for this card
- The Food Timeline, resource created by L Olver
Natural Language Processing
Oh, I have a newsletter (see link in navigation above), if you want to get things like this and more in your inbox you can subscribe from here, entering your email. It’s free.