Stories around the frequency of tags on Stack Overflow
In this post, we’re going to have a look at some data about the tags used on Stack Overflow to label questions, their frequencies and what we can measure around them.
For those who are heavy Stack Overflow users, which is probably pretty much the vast vast majority of the people who do tech, having posts appropriately tagged is vital to navigate the immense archive the site is. At the moment of writing this (January 2018), Stack Overflow contains more that 15 million questions, with a number of unique tags around 54000. The help page here is meant to give some guidelines on how to best use this feature, as it’s super important to have your question tagged in the best way it can in order to be found by the relevant people who can answer it. Tags are names of technologies, like programming languages, frameworks, software or technical elements and components, like coding techniques or computer science general topics.
Bits and bobs of history
Stack Overflow has been launched in September 2008, according to the Wikipedia page and is now quite well-established as the one-go Q&A resource for programming. One year later, in September 2009 (still according to Wikipedia) its successful model has been extended to a general Q&A site divided into sub-sites about many topics (many of which outside tech), Stack Exchange. All in all then, the network has been around for about 8/9 years now, so we’re all preparing to celebrate its 10th year anniversary soon. On this historical note, it’s quite interesting to have a read at this article called Find the answer to anything with StackExchange, from back in 2009 when the network was just born.
The Stack Overflow Wikipedia page also asserts that, as of December 2014, Based on the type of tags assigned to questions, the top eight most discussed topics on the site are: Java, JavaScript, C#, PHP, Android, jQuery, Python and HTML. We’ll see if and how this has changed!
Fetching some data
To query the Stack Overflow API, we’ll use the Python package StackAPI. Note that the API allows 10000 requests every 24 hours.
We’ll fetch the 5000 most frequent tags (those with the highest usage counts) as due to said API limits we can’t fetch them all: if we did split the requests to get fetch all over multiple days, because the usage counts of tags change in time we wouldn’t have a consistent picture. Anyway, 5000 seems way more than enough to see something interesting.
All the methodologies followed and the results are reported in this repo, there is also a Jupyter notebook for those interested. For the figures, note that we will use the XKCD theme for Matplotlib and that we tried to reproduce Stack Overflow’s colours!
Tags and their usage - rich gets richer
First and foremost (this is data pulled on the 11 January 2018), what are the most frequent tags? The frequency is given as the usage count, namely the number of questions tagged with that tag. The figure below shows the top 20 tags by frequency: Javascript is king, with more than 1.5 million occurrences, then we see many other familiar languages and operating systems. Not particularly surprising!
Has anything changed from the end of 2014, where it was claimed (see above) that the most frequent 8 tags were Java, JavaScript, C#, PHP, Android, jQuery, Python, HTML? Well, the who the most frequent 8 are hasn’t changed, but assuming that the sentence was reporting them in order of decreasing frequency, one switch seems to have occurred: Java was more popular than Javascript back then. Is this a sign of times?
It’s also interesting to note that AngularJS is the only Javascript framework that makes it into this top 20 (it was born in 2010, so maybe it’s old enough) and that array is so much discussed as a data structure.
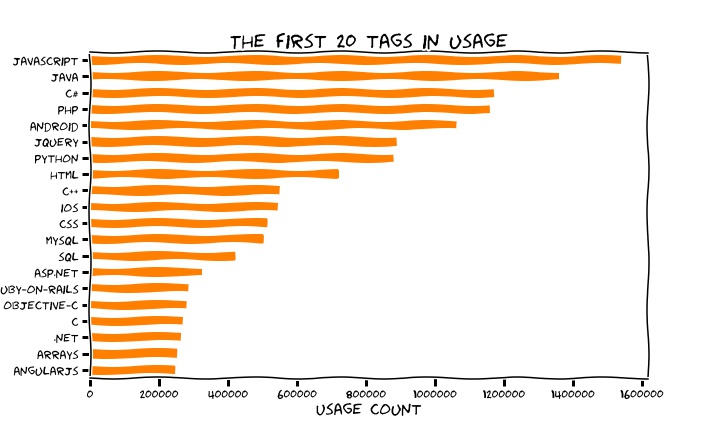
All in all, note that even with such a small set of data, the frequencies span a large interval, the last one shown, AngularJS, sits at about 200k counts, to be compared to the 1.5 millions of Javascript above. Let’s explore how the frequencies of all the tags we retrieved fall with the rank (the position in the sorted-by-frequency list) of the tags. The figure below shows exactly this and makes it clear that tags frequencies are spanning orders of magnitude really.
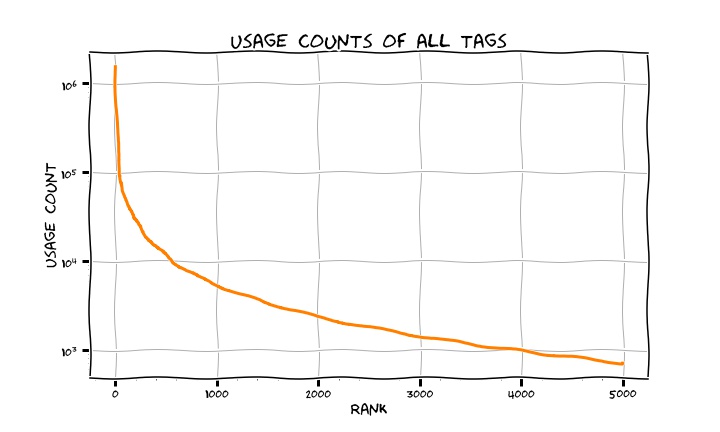
In fact, the distribution of frequencies is power-law and if you fit the trend of frequency vs. rank (the Zipf’s law) you end up with, the inner bulk of the distribution considered, with a trend \(x^{-\alpha}\) with \(\alpha = 0.96\). Does this hint at a rich-gets-richer phenomenon?
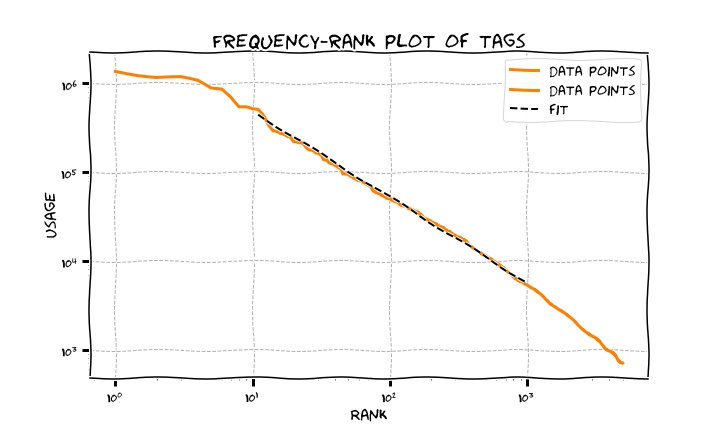
The Zipf law is what governs the trend frequency/rank for words in a language; a power-law trend with slope -1 means that the second most-frequent word is half as frequent as the first one; the third is one third as frequent, and so on. We are sort of seeing the same in regards to the frequency of tags here.
In the preferential attachment (also known more informally as “rich gets richer”) model for text generation, when you choose which words to use, you choose an existing word proportionally to its frequency so that more frequent words have higher probability to be reused, and this generates a power-law trend for the frequencies. In the case of our tags, we infer there might be a similar mechanism underlying what we see and this could be depending on a series of reasons.
First of all, the UI in Stack Overflow suggests you tags for your post, based on the topics of what you wrote. Most frequent tags would get richer as the effort is towards populating the existing ones if they fit, rather than creating a scattered network of scarcely populated tags overall. Furthermore, some languages and tools around are genuinely more popular than others so again this reinforces the frequency of their tags. This is why Javascript is and has presumably always been so popular on the site.
Old gets richer?
We can also ask the data if, by any means, old gets richer as well, that is to say, if tags that are older in time attract more posts. This seems like a reasonable thing to happen as with time flowing there’ll simply be more and more posts on existing tags. As simple as that, but how true is it?
On this, we need to note that the tags/ endpoint of the API does not furnish the creation date of the tag, even though the info page of a tag does. So what we did has been attaching the tag with the creation date extracted from the first question appeared with that tag (querying the search/ endpoint); note that because questions can always be edited, including retagging, this might mean that an old question sees its tags modified when a new tag first appears. This is why some tags have a creation date which is older than the technology they represent (see for instance AngularJS, born in 2010 but whose tag is from 2009).
The plot below here shows a scatter of the usage counts vs. their age (in days, and again this data has been retrieved on the 11 January 2018 so it’s the number of days till then). It also displays an average binning of the usage counts, the bin is 200 days large.
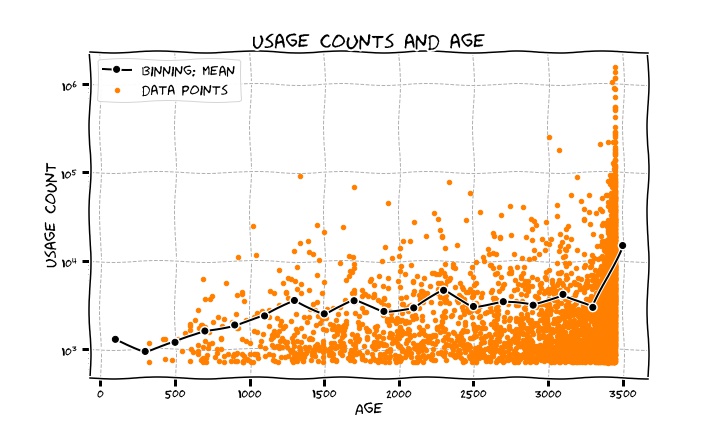
What is noticeable is the quite large jump in the last bin, which is for the oldest tags. Apart from a bit of a jumpy behaviour, there is this effect of old tags getting richer, as expected. But the oldest one get way richer compared to the rest, meaning there is a spike there: you go from around 3000 in the second-to-last bin to 15000 in the last one! This is suggesting that in the first about 200 days of life of the site, the tags which cover the greatly vast majority of popular topics have been created and keep getting huge traction. In around a year since its birth, Stack Overflow has seen most of the topics that are still super popular and of interest today created.
Tags synonyms
Tags can have synonyms. When a question gets tagged with something which is just a variation of something existing, it gets mapped to the mother tag automatically, so the usage counts go against the mother tags, which are those we retrieved. Note that when you query the API for a tag which is a synonym of a mother tag, you get the usage counts for the mother tag.
Tags are collapsed as synonyms of existing ones by the users who achieved a certain reputation, see the help page. This process controls for the multiplication of tags keeping them orderly. As examples, some synonyms of javascript are things like javascript-dom or javascript-module; some of python are python-shell or python-interpreter.
The distribution of the number of synonyms per tag is in figure, again a very skewed situation where just a few tags have large sets of synonyms.
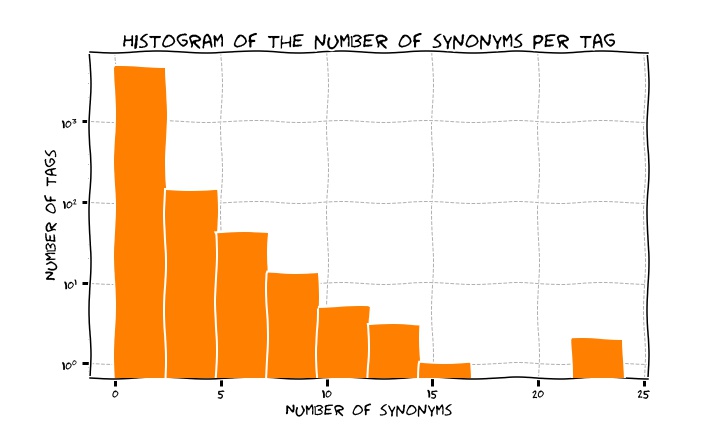
For reference, the tag with most synonyms (25) is css (things like font-weight, dynamic-css, inline-block).
Now, would you expect that tags who have synonyms would receive higher frequency counts? This would be intuitively due to the fact that a tag with synonyms is a tag that can be expressed in multiple flavours, maybe a composite and broad technology and this would mean that people might be interested in different parts of it. We ran a quick t-test to determine if the means of the distributions of usage counts for tags with and without synonyms are significantly different and the result has been that they actually are, with said means sitting at respectively 21500 and 3200: in general terms, tags with synonyms are about 7 times as popular as those with no synonyms.
A note on time trends
In 2017, Stack Overflow introduced a great tool to show the data they generate on the popularity of technologies to everyone, it’s called Stack Overflow Trends and you can read this blog post by D Robinson about it. In short, it’s a UI where you can query for the usage counts data on some tags of your choice, in time, since Stack Overflow was born. We did it for some of the 8 most popular tags mentioned above and this is the result: c# has seen its best age in 2009-2010 and is now on a steady decline; Javascript and Python are on the rise with the first being and having always been the king, Java is in slow decline in the last years.
A small word of caution
The assumptions behind taking these temporal trend results at face value is that Stack Overflow is a representative community of the technologists around, that questions are correctly tagged and data is not biased. As an extreme case for instance, the popularity of a tag might be due to the lack of good documentation of the related tool, not necessarily to the how popular and interesting it is among users: lots of users on the site will be just popping there to get some help on solving a problem they can’t find good references anywhere else.
All in all though, a great tool to see how the world of tech is moving!